- A neutral outlook is seen on the daily chart.
- The hourly chart for AUD/JPY paints a different picture, showcasing mounting buying pressure.
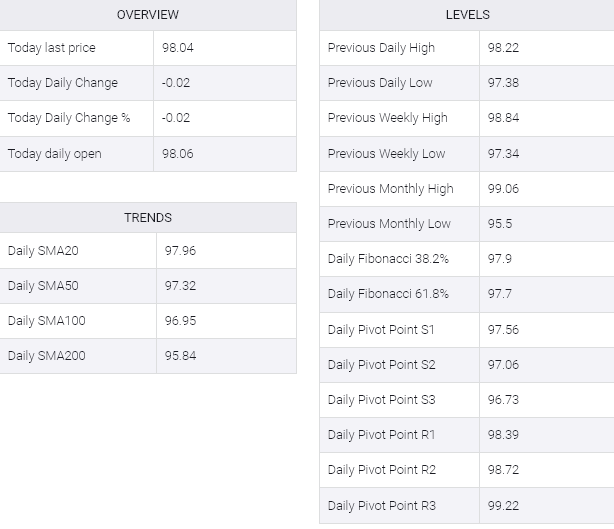
The AUD/JPY pair is presently at 97.99, reflecting marginal losses. The currency pair is navigating a nuanced dynamic where short-term buyers are gaining traction, while the daily chart paints a mixed outlook. Nevertheless, the overall trend remains bullish, with the pair maintaining a position above key Simple Moving Averages (SMAs) spanning 20, 100, and 200 days.
On the daily chart, the AUD/JPY pair demonstrates a neutral momentum, highlighted by the Relative Strength Index (RSI) dipping into negative territory this week. However, the most recent reading showed a minor uptick, indicating a balanced market sentiment. Furthermore, the diminishing red bars in the Moving Average Convergence Divergence (MACD) histogram suggest a waning bearish momentum, casting uncertainty on the sustainability of the recent downward movement.
AUD/JPY daily chart

Examining the hourly chart of the AUD/JPY pair reveals an intriguing juxtaposition. The current positivity observed in the hourly Relative Strength Index (RSI), now situated within positive territory, emphasizes the increasing buying pressure at a more granular level. Furthermore, the ascending green bars on the MACD histogram indicate a growing bullish momentum in this shorter timeframe, dispelling the bearish sentiment suggested by the daily chart.
AUD/JPY hourly chart
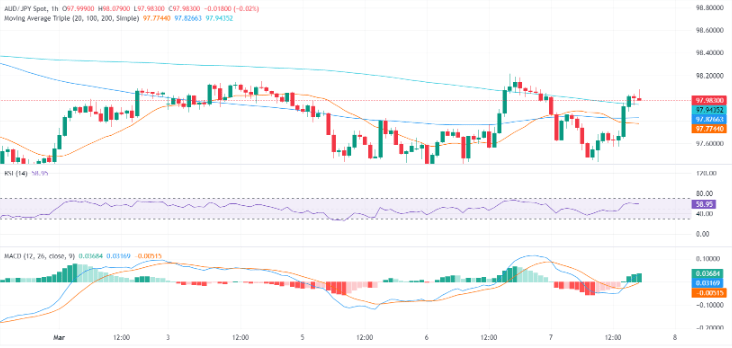
When combining daily and hourly views, it appears that the AUD/JPY is about to experience a period of consolidation after hitting multi-year highs in late February.
AUD/JPY
