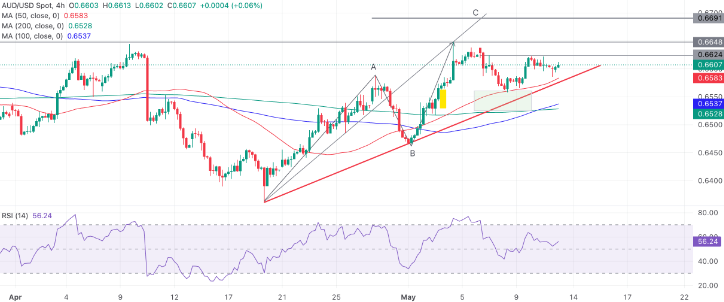
- AUD/USD is in consolidation mode following its retreat from the peak on May 3rd.
- A breach above 0.6624 could trigger a significant upward surge in volatility.
- There are indications that AUD/USD might have completed a Measured Move pattern, with a potential final target around 0.6690.
On Monday, AUD/USD is in the 0.6610s, maintaining its sideways trend after retracting from its peak on May 3rd. Despite a week of lateral movement, there are indications of a short-term uptrend, evident in the ascending sequence of highs and lows since April 19th.
AUD/USD 4-hour Chart

Given the adage “the trend is your friend,” the likelihood leans towards AUD/USD advancing. Despite numerous attempts, AUD/USD has yet to breach the resistance at 0.6624. However, a successful breakthrough would confirm further upside potential towards the May 3 high at 0.6649.
If AUD/USD surpasses 0.6624, it’s anticipated to trigger a notably volatile upward movement, as levels repeatedly tested often lead to strong moves upon breach. The subsequent target might lie around 0.6680-90, possibly suggested by a Measured Move pattern formed since the April 19 lows.
Measured Moves typically involve three waves, labeled A, B, and C. It’s generally expected that wave C will match the length of A or Fibonacci 0.681 of A. While wave C has already met the Fibonacci 0.681 target at the May 3 highs, it could also reach the target where C equals A at 0.6690.
A bearish signal would be signaled by a decisive break below the red trendline, implying a potential trend reversal. Such a break would typically involve a long red candle closing near its low or three consecutive red candles breaking below the trendline.
