- US Crude Oil stocks rose less than expected this week.
- China saw an uptick in Crude Oil demand.
- Market shrugs off more productive US Crude Oil well efficiency.
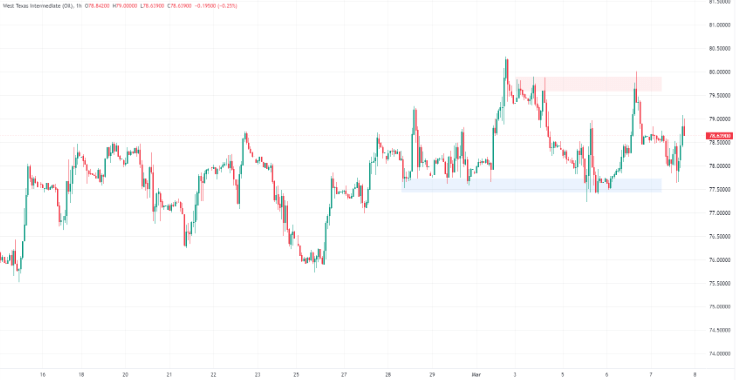
West Texas Intermediate (WTI) experienced an initial decline, approaching $77.60 per barrel early on Thursday. However, a robust rally during the US trading session propelled US Crude Oil back to the upper range for the day. The optimism stems from a less-than-expected increase in US Crude Oil supplies this week, coupled with a reduction in US gasoline reserves, fostering optimism that demand might outpace supply.
Government data from China revealed a noteworthy uptick of over 5% in Crude Oil imports during January and February. This surge is attributed to increased demand fueled by the Lunar New Year holiday, where heightened travel activities contributed to elevated fuel consumption.
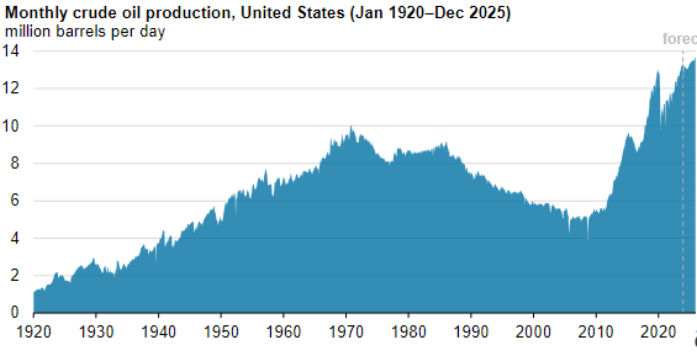
US Crude Oil production maintains its upward trajectory, reaching record levels, with the Energy Information Administration (EIA) indicating a continuation of this trend. The EIA highlights that enhanced efficiency in existing US Crude Oil production facilities is a key factor propelling the overall output volume to new highs. This occurs despite a bearish outlook on the total count of production facilities. While the number of oil rigs in the US is consistently decreasing, and the production of new wells has been on a gradual decline for over a decade, the existing facilities’ improved efficiency remains a driving force behind the increased production levels.
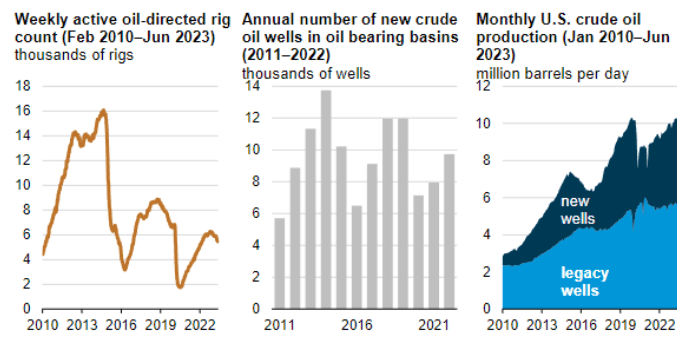
However, previously built or “legacy” wells continue to produce higher amounts of Crude Oil as the US energy market becomes increasingly efficient.
WTI technical outlook
WTI Crude Oil is currently experiencing a tight consolidation phase, restraining US Crude Oil bids within a fluctuating range. The $80.00 level serves as a technical barrier, hindering significant upward movement. Despite a rebound on Thursday, WTI struggles to establish a clear chart pattern above $79.00.
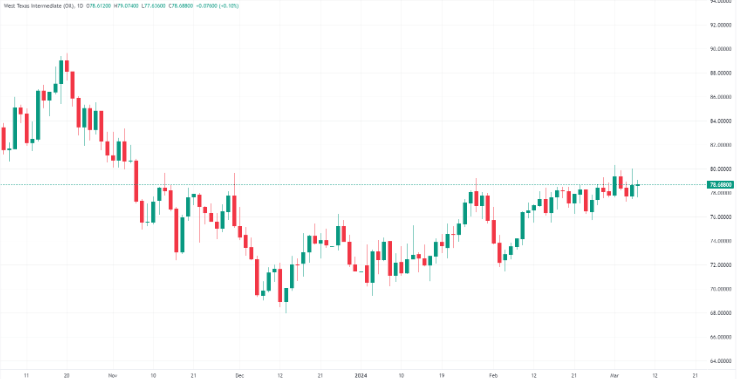
Daily candlesticks reveal a closely intertwined pattern with the 200-day Simple Moving Average (SMA) positioned near $77.90. While US Crude Oil has seen a roughly 10% increase from the early February swing low around $71.50, the momentum for further upside movement appears to have waned in the WTI market.
WTI hourly chart
WTI daily chart
WTI US OIL

