- EUR/CHF touches 50-week SMA and recoils
- RSI on daily chart indicates possibility of a pullback.
- Symmetrical Triangle has formed on 4-hour chart with breakout likely.
EUR/CHF has bounced back from the lows of December 2023, reaching up to a significant resistance level represented by the 50-week Simple Moving Average (SMA). Despite the recent uptick, it is likely that the pair remains within a long-term downtrend.
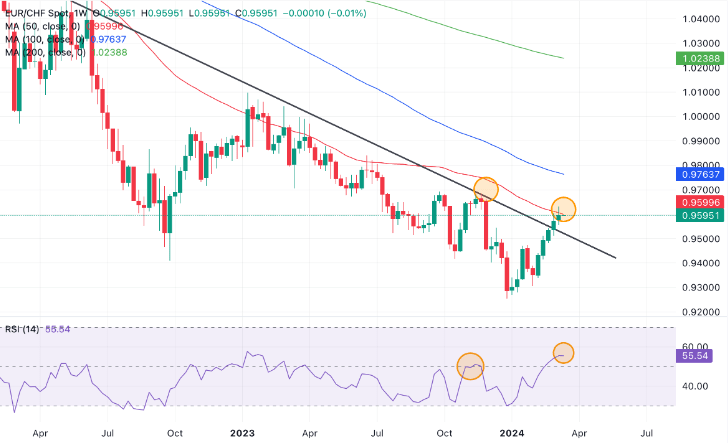
The price has consistently adhered to the red 50-week SMA during previous interactions within its downtrend, underscoring the strength of this level as a resistance point. This implies a potential forthcoming pullback. There is a likelihood of a correction towards the trendline level around 0.9500 for a retest.
Additionally, the convergence of the pair with the Relative Strength Indicator (RSI), a momentum indicator, indicates a bullish trend. Notably, the most recent peak in price coincided with a relatively higher peak in RSI compared to the previous price peak (highlighted), demonstrating convergence and signaling underlying strength.
Furthermore, the pair’s breach above the trendline serves as another bullish indicator.
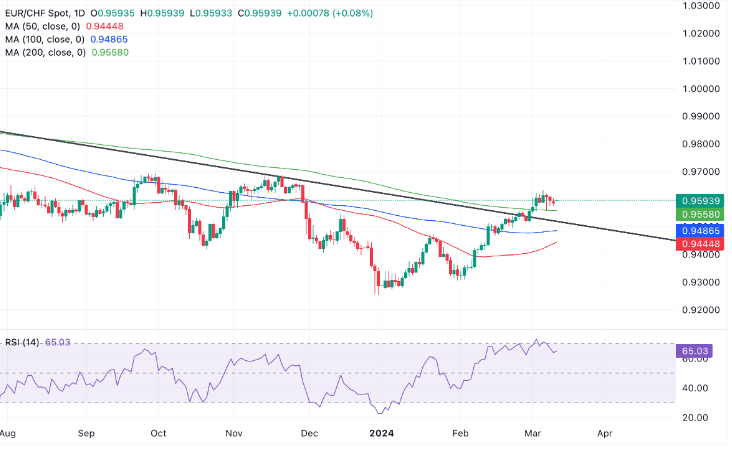
EUR/CHF has recently exited overbought levels on the Relative Strength Index (RSI) displayed on the daily chart. This typically signals an opportunity to sell long positions and initiate short positions. Such a signal suggests a potential downward movement for the pair, with a probable retracement to the level of the trendline around 0.9500.
Moreover, EUR/CHF has surpassed all significant Moving Averages, with the 200-day SMA now acting as a support level. Additionally, the pair has broken above the previous higher low of the downtrend. These developments indicate a likely bullish intermediate trend, which favors bullish sentiment on that particular time horizon.

On the 4-hour chart, EUR/CHF has constructed a Symmetrical Triangle pattern, signaling a period of indecision in the market. While this pattern typically presents an equal probability of breaking out in either direction, some analysts argue that there’s a slight bias towards a breakout aligned with the trend preceding the formation of the triangle, which, in this scenario, is bullish.
In the event of an upside breakout, the potential for significant upward movement may be limited, as triangles often represent the penultimate phase of a trend.
However, it’s worth noting that the RSI has displayed a noticeable decline throughout the formation of the triangle, indicating underlying weakness and the possibility of a downside breakout.
The 4-hour chart serves as a tool to evaluate the short-term trend, with the series of ascending peaks and troughs since the December 2023 lows suggesting that the pair is currently in a short-term uptrend.
