- The pair met strong resistance at the 20-day SMA, which in case of conquering it, will confirm a bullish bias.
- The daily chart indicators suggest a strengthening upward momentum with the RSI jumping above 50.
- The hourly RSI hovers in the overbought territory, a potential sign of short-term buyer exhaustion.
During Friday’s session, EUR/JPY exhibits gains, reaching 162.27, indicating a 0.54% increase as it attempts to surpass the 20-day Simple Moving Average (SMA). The prevailing bullish sentiment appears robust, with buying momentum seemingly growing stronger. However, caution is warranted as sellers may enter the market, given that indicators on the hourly charts are signaling overbought conditions.
Analyzing the daily chart indicators for the EUR/JPY pair, the Relative Strength Index (RSI) has entered positive territory, indicating a more pronounced upward momentum. Additionally, the Moving Average Convergence Divergence (MACD) histogram shows diminishing red bars, implying a strengthening bullish stance.
EUR/JPY daily chart

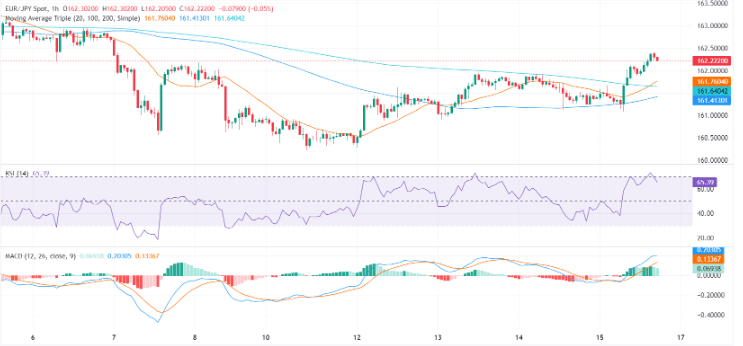
Turning to the hourly chart, the RSI seems to be hovering in the overbought territory. Despite a strong upward trend, this indicates potential exhaustion from the buyers. Similarly, the MACD’s decreasing green bars might be signaling a shift in the tide, turning favor towards sellers for the short-term period.
EUR/JPY hourly chart
The current positioning of the pair presents a mixed outlook: while it remains above the 100- and 200-day SMAs, it’s below the 20-day SMA, creating ambiguity regarding broader market control. Consequently, a combination of signals from both daily and hourly charts indicates an ongoing struggle, with bulls retaining control in the broader context despite potential short-term pressures.
EUR/JPY

