- The EUR/JPY rallied in Tuesday’s session, seeing more than 1% gains.
- The daily RSI reveals growing buying momentum, deep in positive territory.
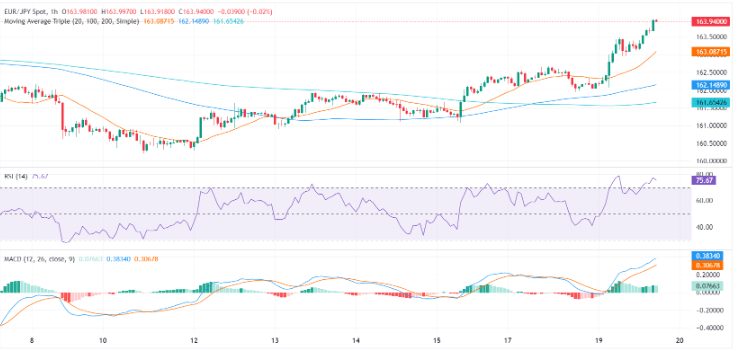
- The hourly chart hints at overbought conditions, and the RSI staying above 70 signals the potential for profit-taking sell-offs.
During Tuesday’s trading session, the EUR/JPY pair surged to approximately 164.00, marking a significant rally of 1.14%. The daily outlook appears to be favoring buyers, although signs of overbought conditions on the hourly chart suggest an imminent period of consolidation.
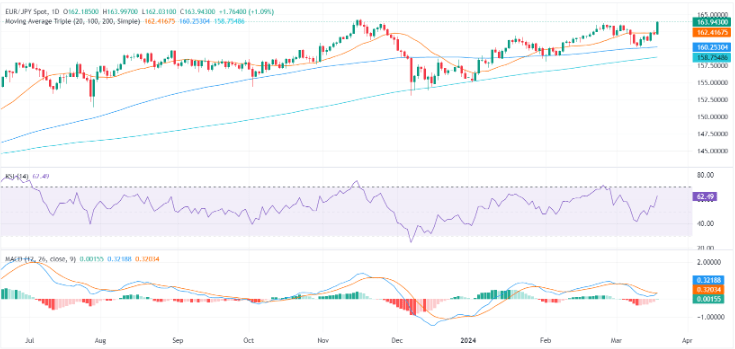
On the daily chart, there is a notable increase in momentum, as evidenced by the latest Relative Strength Index (RSI) values. Starting from negative levels, the RSI trajectory has transitioned into positive territory, recently peaking at 65, which is nearing overbought levels. Presently, buyers are exerting dominance in the market, raising the likelihood of the pair entering overbought territory in the near future.
EUR/JPY daily chart

Upon scrutinizing the hourly chart, the EUR/JPY pair reveals sustained overbought conditions. The RSI consistently maintains robust values above 70, indicating significant buying pressure. Further reinforcing this bullish momentum, the Moving Average Convergence Divergence (MACD) exhibits ascending green bars. Nevertheless, these prolonged overbought conditions may trigger a corrective downturn, as excessive buying could prompt profit-taking sell-offs.
EUR/JPY hourly chart

Conclusively, both the daily and hourly charts indicate robust buying momentum. The positive outlook is further corroborated by the pair trading above the main Simple Moving Averages (SMAs) of 20, 100, and 200 days. Any downward correction which keeps the pair above these levels, won’t affect the overall bullish trend.
EUR/JPY

