- EUR/USD trades lower on Tuesday after the release of US CPI data for February.
- The data shows inflationary forces remaining stubbornly high.
- US CPI has impacted the timing of Fed interest rate cuts, indicating a hgiher chance they will be delayed – USD positive.
During the US session on Tuesday, EUR/USD dipped into the lower 1.0900s following the release of the US Consumer Price Index (CPI) inflation data, which revealed higher-than-expected inflationary pressures in February.
The CPI report suggests that the Federal Reserve (Fed) may need to maintain higher interest rates for an extended period to mitigate economic overheating. Prolonged higher interest rates typically bolster the US Dollar by attracting increased foreign capital inflows.
However, the significant contribution of gasoline and energy prices to the elevated inflation is likely to restrain the downside potential of EUR/USD. These factors are perceived as less entrenched pressures and are susceptible to global commodity price fluctuations.
US CPI comes out higher than forecast
On Tuesday, the EUR/USD continued its downward trend as US inflation data revealed unexpected resilience in February.
The core US Consumer Price Index (CPI), excluding food and energy prices, came in at 3.8% year-on-year (YoY), surpassing analysts’ expectations of 3.7%. Although slightly lower than January’s 3.9%, this figure indicates that inflation remains elevated, albeit not declining as swiftly as anticipated. On a monthly basis, core CPI increased by 0.4%, exceeding the forecast of 0.3% and matching January’s growth rate.
The broader headline CPI also saw an unforeseen uptick, with a YoY rise of 3.2%, compared to the forecasted 3.1%. Similarly, the monthly headline CPI climbed by 0.4%, aligning with estimates and surpassing January’s 0.3% increase.
Following the CPI release, the CME FedWatch Tool, which gauges market-based expectations of Federal Reserve actions, reflected a reduced probability of a rate cut in March, dropping to 1% from 3% pre-CPI release. The likelihood of one or more 25 basis points cuts by May slightly decreased to 16.8% from 17.1%, while the probability of rate cuts by June dipped to 69.7% from 71.4% prior to the data.
Euro overpriced and likely to fall
According to BNY Mellon strategist Geoffrey Yu, the Euro is currently overvalued due to relatively weaker growth in the Eurozone and the anticipated earlier rate cuts in Europe compared to the United States.
In an interview with Bloomberg news on Monday, Yu expressed his expectation for the Euro to depreciate against the US Dollar throughout 2024. He maintained his stance, suggesting that parity with the Dollar could be reached at some point this year.
Yu highlighted that the Euro’s weakness is expected to stem from both economic struggles in the Eurozone and the European Central Bank (ECB) potentially implementing interest rate cuts before the Federal Reserve.
The recent failure of EUR/USD to sustain highs just below 1.1000 followed comments from Banque de France Governor François Villeroy de Galhau and Bundesbank President Dr. Joachim Nagel. Both officials indicated that a rate cut in the spring might be warranted.
Villeroy de Galhau specifically mentioned that “spring goes from April to June 21,” suggesting a potentially wider timeframe for rate adjustments. Their position contrasts with ECB President Christine Lagarde’s more moderate stance, who suggested that the ECB would review its interest rate policy in June during her press conference after the policy meeting on March 7.
Technical Analysis: EUR/USD pulling back
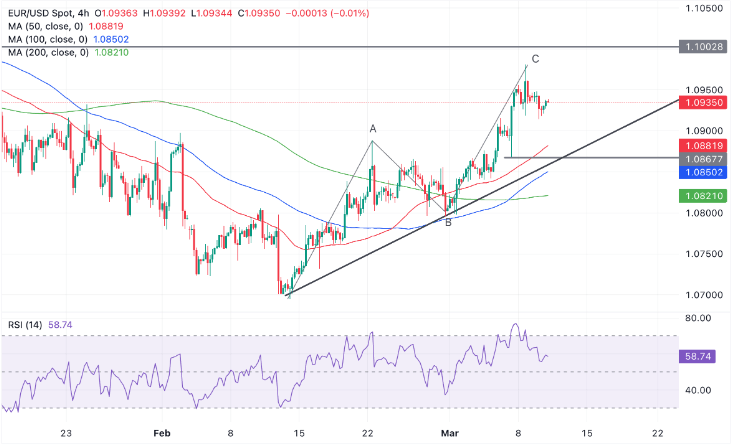
After reaching a peak of 1.0981 on March 8th, EUR/USD has retraced its gains.
However, despite this correction, the pair continues to exhibit a short-term uptrend pattern on the 4-hour chart. This trend is characterized by consistently higher highs and higher lows. As a result, the overall trend still favors bullish positions.

The EUR/USD pair appears to have completed a three-wave ABC Measured Move pattern, indicating the potential for a significant correction.
The pullback has unfolded in three distinct waves since Friday’s peak, and there is a chance it may have concluded. However, there remains the possibility of further downside movement.
One potential support zone for the correction lies between the February 2 high at 1.0898 and the top of the Measured Move’s A wave at 1.0888. Alternatively, the correction could extend to support in the 1.0860s.
Despite the potential for further downward movement, given the prevailing uptrend bias, prices are likely to eventually find support, recover, and resume their upward trajectory.
The emergence of a short-term reversal pattern, such as a bullish candlestick reversal pattern, would signal a potential resumption of the uptrend.
Resumption of uptrend
A breach beyond 1.0955 would offer stronger indications that the uptrend is resuming. Furthermore, surpassing the March 8 high of 1.0981 would signify a robust signal of the bullish trend gaining further momentum.
Nevertheless, reaching the formidable resistance at 1.1000 could potentially curtail any immediate upward movement, unless backed by compelling fundamental factors. This psychological level is anticipated to witness a clash between bullish and bearish forces, likely leading to heightened volatility.
However, a clear and decisive breakthrough above 1.1000 would pave the way for extended gains towards the subsequent significant resistance level at 1.1139, marked by the December 2023 high.
Such a decisive breakthrough would be characterized by a prominent green bar piercing decisively above the level and closing near its peak, or alternatively, by the occurrence of three consecutive green bars breaching the level.
