- GBP/USD sheds weight after rate cut expectations get pushed out.
- NY Fed noted an uptick in consumer inflation expectations.
- Markets await Tuesday’s US CPI inflation print.
On Monday, GBP/USD retraced some gains, slipping from 1.2860 to the 1.2800 price level as market expectations for a rate cut from the Bank of England (BoE) were scaled back. UBS anticipates the BoE to implement its first rate cut in August, a shift from the previously projected May timeline.
Investors are eagerly awaiting Tuesday’s release of UK labor figures and the US Consumer Price Index (CPI) inflation data. The ongoing speculation regarding potential rate cuts from both the BoE and the Federal Reserve (Fed) continues to influence market sentiment.
The UK’s ILO Unemployment rate for the quarter ending January is predicted to remain unchanged at 3.8%, while Annualized Average Earnings Including Bonuses are expected to dip from 5.8% to 5.7%. Average Wages Excluding Bonuses are forecasted to stay at 6.2%, with market expectations pointing towards a decline in consumers’ bonuses.
Looking ahead to the US, February’s Month-on-Month CPI is projected to accelerate to 0.4%, up from the previous 0.3%, reflecting persistent uneven inflation. The Core Month-on-Month CPI, excluding food and energy prices, is expected to ease to 0.3% from the previous 0.4%.
Annualized CPI is forecasted to remain steady at 3.1%, while Core Year-on-Year CPI is expected to decrease to 0.3%, down from the previous 0.4%.
GBP/USD technical outlook
After a six-day winning streak, GBP/USD is poised to reverse course and head lower on Monday. The pair briefly breached a substantial supply zone, but its inability to sustain above the 1.2900 level on Friday is pushing GBP/USD back below resistance.
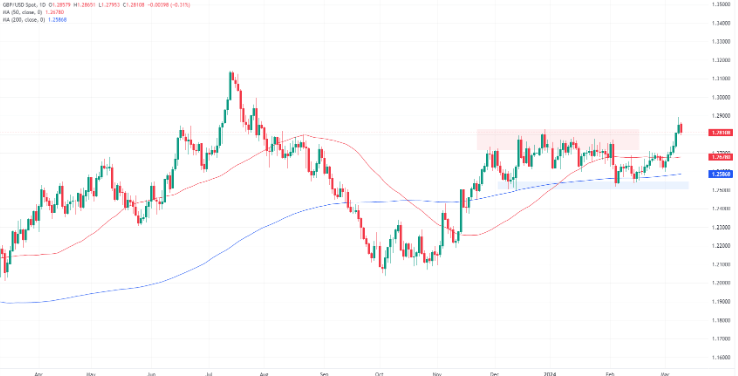
Despite the current bearish momentum in the short term, it’s worth noting that the pair still maintains a position comfortably above the 200-day Simple Moving Average (SMA) at 1.2586. Since the last significant swing low at 1.2518, GBP/USD has surged by 3% from the bottom to the top.
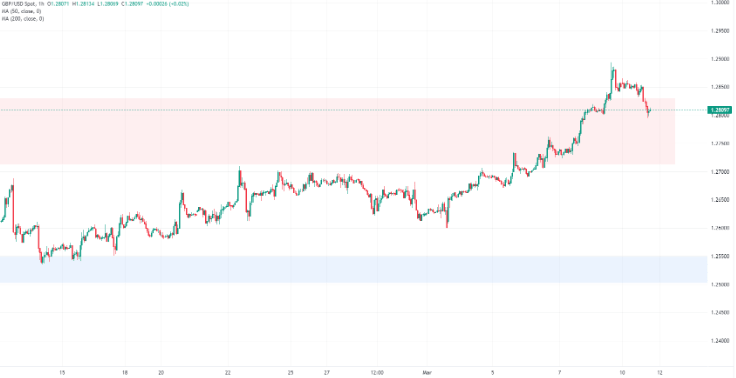
GBP/USD hourly chart
GBP/USD daily chart
