- GBP/USD slips by 0.30% as the US Dollar gains ground fueled by encouraging US trade and labor figures.
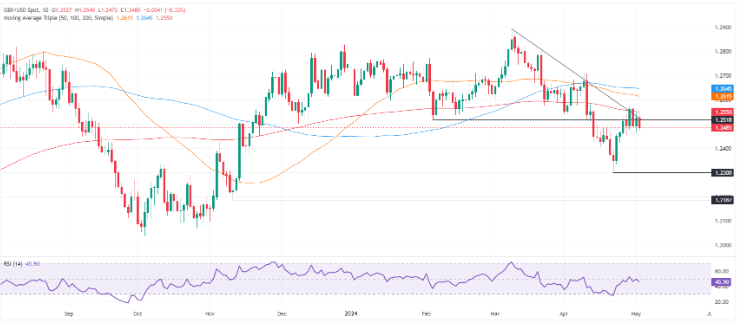
- The currency pair grapples beneath the 200-day moving average at 1.2550, depicting a downward trajectory.
- Bearish momentum is evident as indicated by the RSI, signaling dominance of sellers in the market.
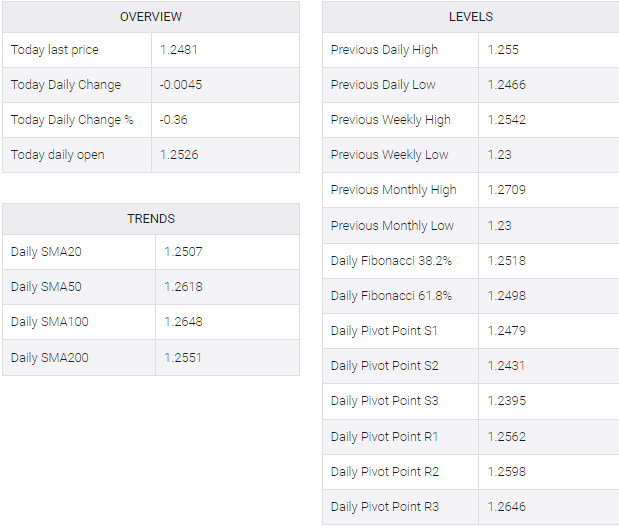
- A potential rebound above the critical 1.2500 mark might prompt a retest of the 200-day moving average, with resistance levels anticipated at 1.2569 and the 50-day moving average at 1.2613.
In the early stages of the North American session, the Pound Sterling took a tumble, slipping below the 1.2500 mark amidst a resurgence in US Dollar vigor. US data indicated a narrowing of the Balance of Trade deficit alongside a resilient labor market, highlighted by the Initial Jobless Claims report. Currently, the GBP/USD is trading at 1.2488, marking a 0.30% decline.
GBP/USD Price Analysis: Technical outlook
Technically, the GBP/USD is exhibiting a neutral to downward bias as attempts by buyers to breach the significant resistance level at the 200-day moving average (DMA) of 1.2550 have been unsuccessful. This failure has exacerbated the decline below the crucial 1.2500 mark, potentially setting the stage for a test of the recent cycle low recorded at 1.2299 on April 22.
Momentum signals a continuation of the downtrend, with the Relative Strength Index (RSI) turning bearish on April 30 and currently pointing downwards, indicating the prevailing control of sellers.
However, in the event that buyers manage to reclaim the 1.2500 level, their focus would shift towards recapturing the 200-DMA before targeting the April 29 high at 1.2569. Subsequent hurdles would include the 1.2600 threshold, followed by the 50-DMA at 1.2613. Further upside potential is noted beyond the 100-DMA situated at 1.2644.
GBP/USD Price Action – Daily Chart

GBP/USD

