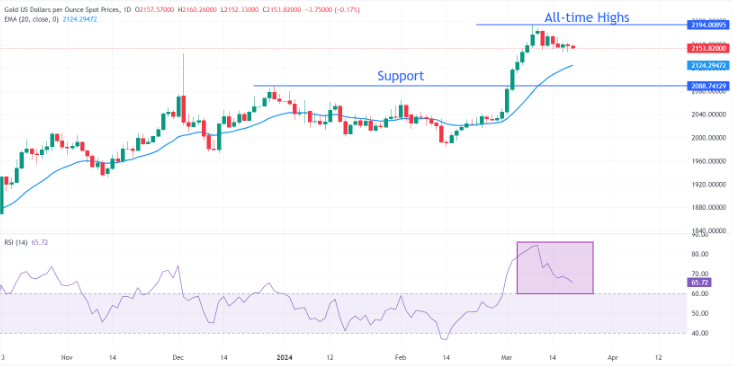
- As the US Dollar strengthens in anticipation of the Federal Reserve’s monetary policy announcement, gold prices continue to decline.
- Market focus centers on the Fed’s dot plot as the pivotal factor during the monetary policy meeting.
- Although US Treasury yields experience a modest decrease, they predominantly maintain a strong position.
In the early American session on Wednesday, gold prices (XAU/USD) remain subdued as investors await the Federal Reserve’s (Fed) monetary policy decision, scheduled for announcement at 18:00 GMT. Anticipated to keep interest rates unchanged, the Fed’s focus remains on tackling persistent inflationary pressures in the United States, which have yet to show signs of abating. Market attention is particularly directed towards the Fed’s dot plot and economic forecasts, providing insights into interest rate projections and the US economic outlook, respectively.
Investor interest also centers on Fed Chair Jerome Powell’s press conference, offering cues on the potential timing of rate adjustments. Currently, expectations for a rate cut in the June meeting have somewhat diminished. Fed policymakers emphasize the need for sustained evidence of inflation moderation over several months to support the notion of a return to the 2% target. However, recent inflation data for the initial months of 2024 indicate lingering price pressures.
Meanwhile, 10-year US Treasury yields have gradually retreated to 4.28% from their three-month peak of 4.35%. A hawkish stance from the Fed could prompt an increase in Treasury bond yields. Preceding the Fed’s announcement, the US Dollar Index (DXY) sustains its upward momentum for the fifth consecutive trading session, fueled by persistent inflation concerns casting doubt on the Fed’s prior projections of three rate cuts for the year.
Daily digest market movers: Gold price drops as US Dollar strengthens
- Gold prices edge slightly lower to $2,150 amid prevailing uncertainty ahead of the Federal Reserve’s interest rate decision. Widely expected to maintain interest rates within the range of 5.25%-5.50% for the fifth consecutive time, market attention is primarily fixated on the Fed’s dot plot and economic projections.
- The Fed’s dot plot, updated quarterly, provides insight into policymakers’ interest rate forecasts across various timeframes. December’s dot plot hinted at three rate cuts for 2024, indicating a perceived peak in the rate-tightening cycle. Fed officials emphasize that rate cuts are warranted only upon sustained evidence of inflation trending towards 2%, with core Consumer Price Index (CPI) data serving as a primary gauge, devoid of volatile food and energy prices. Persistent stickiness in core inflation during the initial months of 2024 fuels speculation that the Fed may project fewer than three rate cuts for the year, potentially increasing the opportunity cost of investing in non-yielding assets like Gold, thereby exerting downward pressure on its price.
- According to the CME FedWatch Tool, there is a 60% probability of at least three rate cuts by 2024. This likelihood, previously below 80%, declined following the release of February’s elevated consumer and producer inflation data. The higher-than-anticipated US inflation figures have tempered market expectations for the Fed to commence rate cuts in the June policy meeting.
- Later this week, investor focus will shift towards the preliminary S&P Global Manufacturing and Services PMI for March. The Manufacturing PMI is forecasted to dip to 51.7 from February’s 52.2 level.
Technical Analysis: Gold price drops to near $2,150

Gold prices experienced a decline after encountering significant resistance around the crucial level of $2,160. The precious metal remained within Tuesday’s trading range, suggesting a consolidation phase. Market analysts anticipate a potential breakout from this consolidation pattern following the conclusion of the Federal Reserve’s policy meeting.
It is anticipated that gold may extend its downward movement towards the 20-day Exponential Moving Average (EMA) positioned at $2,097. Following a notable divergence, the asset typically undergoes a mean-reversion process, leading to either a price or a time correction.
On the downside, key support levels are expected to emerge near the December 4 high around $2,145 and the December 28 high at $2,088.
The 14-Relative Strength Index (RSI) has retreated from its peak around 84.50, indicating a moderation in the upside momentum. However, the prevailing upward trend remains intact.
