- Gold price falls sharply on hot US PPI data for February.
- The US Retail Sales grew by 0.6%, failing to meet expectations.
- Higher US bond yields weigh on the Gold price.
In Thursday’s early New York session, the price of gold (XAU/USD) experiences a significant decline following the release of a hotter-than-expected Producer Price Index (PPI) for February by the United States Bureau of Labor Statistics (BLS). The surge in inflationary concerns has exerted pressure on the precious metal.
The heightened uncertainty regarding Federal Reserve (Fed) rate cut expectations for the June policy meeting stems from the trend of elevated inflation data, following the release of similarly hot February inflation figures earlier in the week. Consequently, yields on 10-year US Treasury bonds have surged to 4.28%, increasing the opportunity cost of holding non-yielding assets like gold. The strengthening of the US Dollar Index (DXY) to 103.10 further compounds the situation, rendering gold more expensive for investors.
In contrast, Retail Sales data from the US Census Bureau indicates a slower-than-anticipated growth, suggesting potential headwinds for economic expansion. Looking ahead, the key catalyst for the gold price will be the Fed’s interest rate decision and the new dot plot, which outlines interest rate projections. The previous dot plot, released in the December meeting, hinted at the possibility of three rate cuts this year. Given the firm stance of the US Dollar (USD) and bond yields, these factors are expected to continue influencing the trajectory of gold prices.
Daily digest market movers: Gold price slumps as US yields soar after hot US PPI
Gold prices tumble to $2,160 as they face pressure from elevated US bond yields and a resilient US Dollar, fueled by stubborn Producer Price Index (PPI) data for February. The annual core PPI, which excludes volatile food and energy prices, maintained a steady growth rate of 2.0%, surpassing expectations of 1.9%. Meanwhile, monthly underlying inflation data surged by 0.3%, outpacing the projected 0.2%, although it remained lower than the previous reading of 0.5%.
On the headline front, monthly PPI exhibited robust growth of 0.6%, exceeding both expectations and the previous reading of 0.3%. Annually, PPI accelerated to 1.6%, surpassing the consensus of 1.1% and January’s 1.0%. The PPI data serves as a gauge of the rate at which producers adjust prices of goods and services at factory gates.
The persistent nature of US PPI figures has tempered market expectations for potential Fed rate cuts in June. According to the CME FedWatch tool, the probability of a rate cut in June has dipped to 63% from 69% following the release of the PPI data.
Meanwhile, the US Census Bureau’s report on monthly Retail Sales indicates a moderate 0.6% growth in February, falling short of the anticipated 0.8%. Notably, January witnessed a significant contraction of 1.1%. Investors closely monitor Retail Sales data to gauge household spending trends, a key driver of economic growth in the US.
Technical Analysis: Gold price drops to $2,160

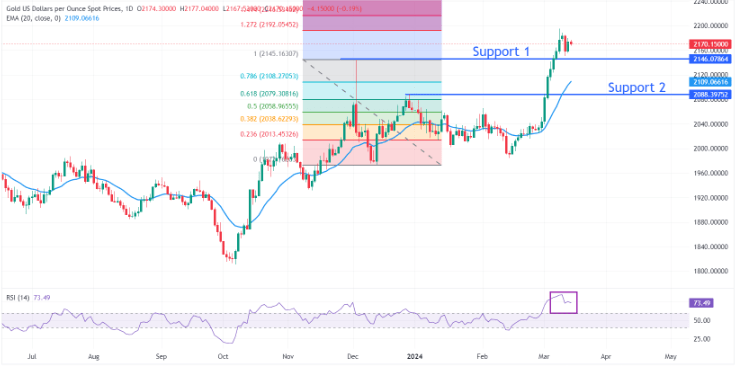
Gold price is currently consolidating within the trading range observed on Tuesday, spanning from $2,154 to $2,180. The precious metal appears to be gradually entering a phase of non-directional movement, characterized by a sharp reduction in volatility. Earlier, gold experienced a decline subsequent to reaching a fresh all-time high close to $2,195, a level coinciding with the 1.27% Fibonacci extension level, plotted from the high of December 4 near $2,145 to the low of December 13 at $1,973.3.
Support levels to watch on the downside include the high from December 4 near $2,145 and the high from December 28 at $2,088, both of which are expected to serve as significant support zones.
While the 14-Relative Strength Index (RSI) retraces from its peak near 84.50, indicating a moderation in upward momentum, the overall upside momentum remains intact.
