- Bearish pressure intensified on the daily chart, and the pair lost the 20-day SMA.
- As the pair lies deeply oversold on the hourly chart, buyers might start taking profits.
The NZD/JPY pair is currently trading at 90.748, experiencing a notable decline of 0.98%. Despite encountering significant selling pressure, the pair remains positioned above its 100 and 200-day Simple Moving Averages (SMAs), indicating a prevailing bullish sentiment in longer-term timeframes. However, the breach of the 20-day average suggests a more negative short-term outlook.
Examining the indicators on the daily chart, several key dynamics emerge. The Relative Strength Index (RSI), currently at 43, resides in negative territory. Its downward trend implies a dominance of sellers in the current market conditions. Additionally, the Moving Average Convergence Divergence (MACD) histogram depicts increasing red bars, further supporting the notion of negative momentum in the market.
NZD/JPY daily chart

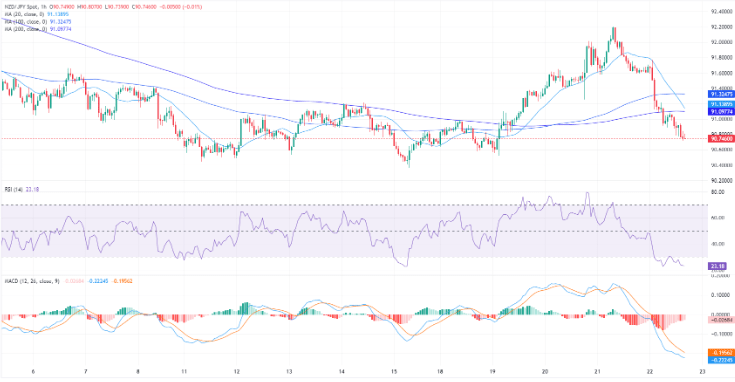
Shifting to the hourly chart, the RSI shows a value of 23, indicating that the pair is deeply oversold. Compared to the daily chart, an amplified negative trend is apparent. However, the MACD on this shorter time frame similarly showcases flat red bars, emphasizing the current bearish momentum but a less intense grip which might suggest that the pair might start consolidating.
NZD/JPY hourly chart
If the bulls want to maintain the overall bullish trend, they must defend the 100 and 200-day SMAs. In case lost, the bearish pressure might intensify further. In the meantime, they could act as a support for sellers to consolidate their downward movements.
NZD/JPY
