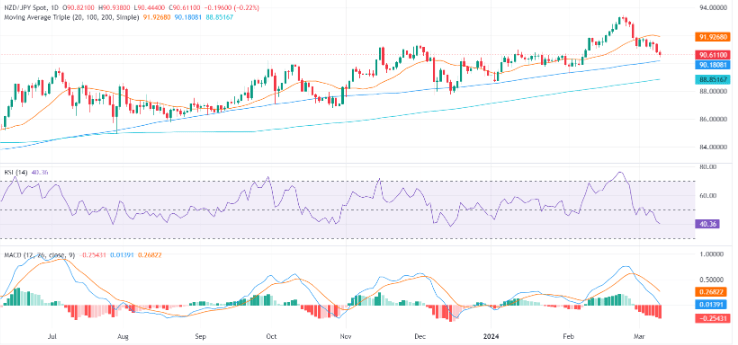
- The daily chart indicates a supremacy of sellers, as depicted by the RSI’s continuation below 50 and a growing MACD negative momentum.
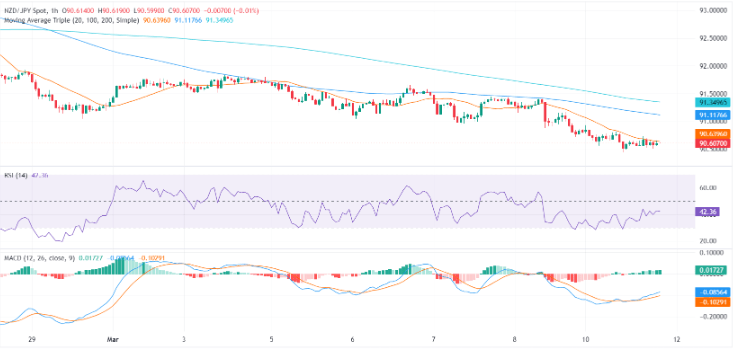
- Small signs of recovery are evident on the hourly chart.
- Despite hourly swings favoring the bulls, overall market bias in the NZD/JPY remains bearish.
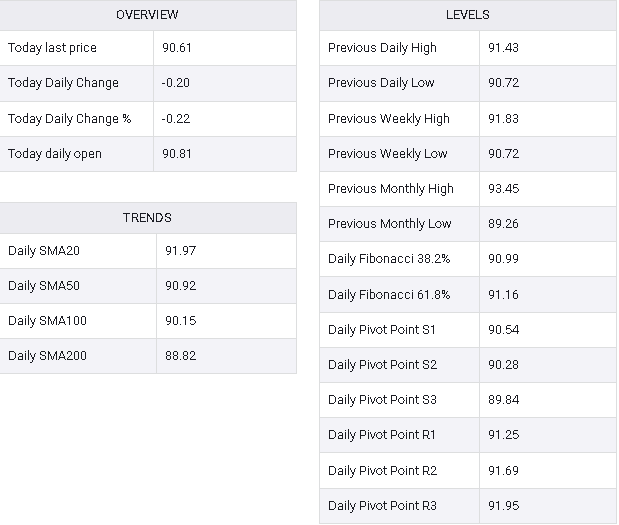
The NZD/JPY is presently trading at 90.61, marking a slight decline at the beginning of the week. Sellers maintain a notable control, contributing to an overall negative technical outlook for the pair. However, on the hourly chart, indications of buyer interest are becoming apparent.
Examining the daily chart for the NZD/JPY pair, the Relative Strength Index (RSI) is positioned in negative territory. The RSI’s consistent decline from levels above 50 to 36 suggests the prevailing influence of sellers in the market. Additionally, the daily Moving Average Convergence Divergence (MACD) displays ascending red bars, signaling an uptick in negative momentum, further reinforcing the dominance of sellers.
NZD/JPY daily chart
Conversely, the hourly chart for the NZD/JPY reveals a modest rebound in the Relative Strength Index (RSI) near its midpoint, registering around 42 in the latest reading. However, this slight uptick does not significantly challenge the prevailing negative bias. Initial indications of a potential positive shift are also evident in the Moving Average Convergence Divergence (MACD), where the emergence of green bars suggests the development of positive momentum in the short term.
NZD/JPY hourly chart
In summary, although there is a marginal positive shift observed in the hourly indicators, the overarching market bias for the NZD/JPY remains negative, as indicated by the daily chart. The pair trading below the 20-day Simple Moving Average (SMA) indicates a negative short-term outlook. Nevertheless, the positive divergence between the MACD and RSI on the hourly chart suggests a potential bullish reversal in the near term, contingent upon additional confirmation.
NZD/JPY
