- On the daily chart, indicators are consolidating but the outlook is favoring the bulls.
- The hourly chart gives hints of mounting selling traction with indicators deep in the red.
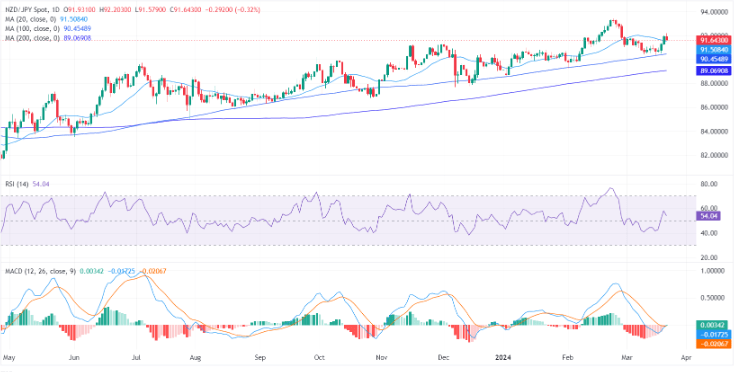
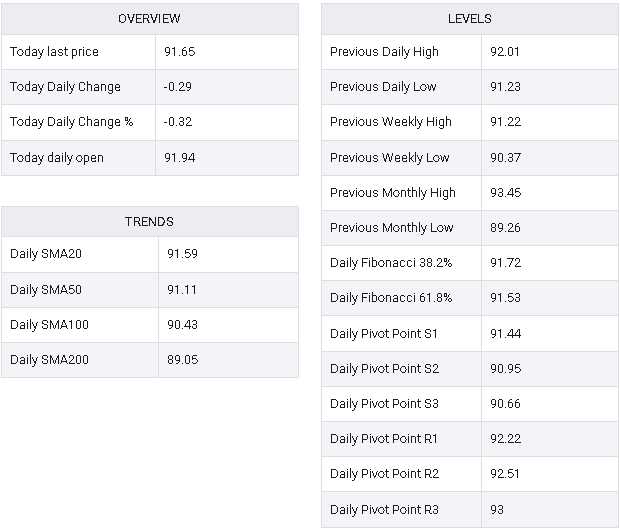
The NZD/JPY pair is presently trading at 91.60, showing a slight decline in Thursday’s session. Despite brief selling pressure, bullish sentiment remains robust, with the pair maintaining its position above the 20, 100, and 200-day Simple Moving Averages (SMAs).
On the daily chart, buyers dominate the market, evident from the Relative Strength Index (RSI) edging towards positive territory. Although the latest reading stands at 55, signaling positivity, it points downward as indicators consolidate. Concurrently, the Moving Average Convergence Divergence (MACD) illustrates a declining trend with red bars, suggesting a steady but weakening negative momentum.
NZD/JPY daily chart
Examining the hourly landscape offers a more nuanced view. The Relative Strength Index (RSI) has displayed fluctuations around the negative territory in recent hours, reaching a reading of 45 in the last hour. This indicates a heightened level of selling pressure in the short term, contrasting with the broader daily perspective. The consistent presence of red bars in the MACD further reinforces this observation, highlighting the negative momentum echoed in the RSI. This dynamic suggests a scenario where sellers are becoming more active as buyers appear to be capitalizing on profits.
NZD/JPY hourly chart

Overall, while bulls are in command of the broad trend, the pair could see some additional selling pressure, as selling momentum is present and buyers might continue taking profits from the last two days’ gains.
NZD/JPY
