- NZD/USD encounters temporary support around 0.6070, with a prevailing inclination toward downside movement due to the gloomy market sentiment.
- Federal Reserve Chair Powell is likely to uphold a hawkish stance in his testimony before Congress on Wednesday.
- The New Zealand Dollar’s appeal remains unaffected despite China’s ambitious growth target.
The NZD/USD pair experiences a rebound after dipping near 0.6070 during the European session on Tuesday. The Kiwi asset is poised for uncertainty as investors await the testimony of Federal Reserve (Fed) Chair Jerome Powell before Congress, scheduled for Wednesday and Thursday.
It is anticipated that Fed Powell will adhere to a hawkish stance, given the absence of evidence signaling substantial progress in inflation declining toward the 2% target.
Market sentiment remains cautious leading up to Fed Powell’s testimony, as evidenced by significant losses in S&P 500 futures during the London session. The US Dollar Index (DXY) shows a slight uptick of 0.03% at 103.85.
Despite Chinese Premier Li Qiang’s ambitious 5% Gross Domestic Product (GDP) target for 2024, the New Zealand Dollar fails to garner increased demand. The New Zealand economy is a major trading partner of China, and typically, positive Chinese economic prospects have a favorable impact on the Kiwi Dollar.
NZD/USD retreats towards the horizontal support of the Descending Triangle pattern on a four-hour timeframe, established from the January 23 low at 0.6062. The downward-sloping border of this pattern is drawn from the December 25 high at 0.6410.
Descending Triangle patterns usually reflect indecision among market participants but tend to lean slightly towards the downside due to lower highs and flat lows.
The asset remains below the 50-period Exponential Moving Average (EMA) near 0.6118, indicating uncertainty in near-term demand.
The 14-period Relative Strength Index (RSI) dips into the bearish range of 20.00-40.00, reflecting a “sell on rise” behavior among market participants.
Looking ahead, a downside movement below the February 13 low near 0.6050 could expose the asset to the psychological support of 0.6000, followed by the November 9 high at 0.5956.
On the contrary, an upward move would materialize if the asset breaks above the round-level resistance of 0.6200, propelling it towards the February 22 high at 0.6220, followed by the January 11 high at 0.6260.
NZD/USD four-hour chart

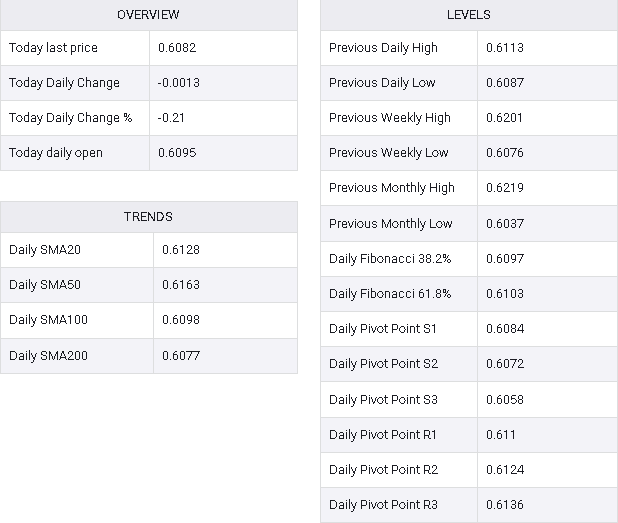
NZD/USD
