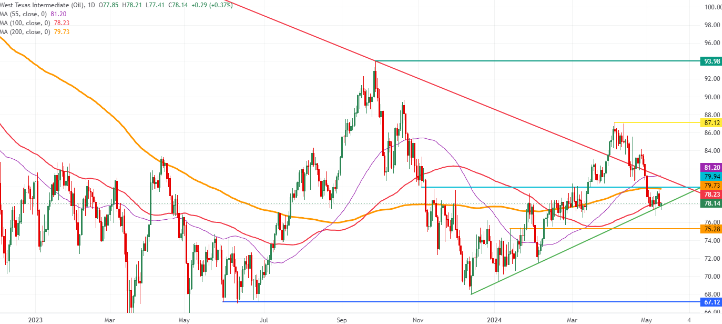
- Oil dips to $78.00 following an unsuccessful push above $80.00 on Friday.
- Criticism towards Israel’s Gaza strategy intensifies worldwide.
- The US Dollar Index stabilizes around 105.30 ahead of upcoming US CPI data.
Oil prices see a modest uptick on Monday, but cautionary signals emerge as they closed nearly unchanged last week. Despite escalating tensions in the Middle East, particularly with the US suspending certain arms deliveries to Israel amid concerns over the Rafah offensive, oil fails to rally. Speculation grows over OPEC+ maintaining its voluntary production cuts at the upcoming June meeting.
Meanwhile, the US Dollar Index (DXY) remains within a two-week range around 105.30, with uncertainty prevailing. Traders contemplate various scenarios, from a soft landing to stagflation. All eyes are on Wednesday’s US Consumer Price Index (CPI) release, which will indicate if the high inflation levels seen in the first quarter persist into April.
Currently, Crude Oil (WTI) is trading at $78.06, while Brent Crude sits at $82.70.
Oil news and market movers: Easing further
- According to Arab News, several oil traders have confirmed that part of the recent correction is attributed to the expectation of reduced demand linked to the US Federal Reserve’s decision to maintain steady interest rates for an extended period. A potential rate cut is seen as a stimulus for the economy, which could consequently boost oil demand.
- Goldman Sachs released a report on Monday stating that they no longer anticipate OPEC+ to announce any partial easing of the voluntary production cuts at the upcoming June meeting.
- Meanwhile, Bloomberg reports a significant decline in crude oil storage on tankers, which has decreased by 11% since last week. As of May 10, the storage levels have dropped to only 55.92 million barrels, marking the lowest level since February 2020.
Oil Technical Analysis: Hanging by a thread
Oil prices are signaling caution as they hover around a critical risk level. Positioned just above the upward trend line, a breach below could trigger a potential decline first to $75.00 and then to $68.15, representing declines of 3% and 10% respectively. This shift reflects traders’ growing awareness of the risk landscape in the Middle East.
On the positive side, the key resistance remains at $79.73, marked by the 200-day Simple Moving Average (SMA). Surpassing this level would encounter further resistance at the $78.23 mark, represented by the 100-day SMA and a descending trend line. Beyond this zone, the path opens up towards $87.12 once again.
Conversely, $75.28 stands as a crucial support level, serving as the last significant barrier against further decline. Failure to hold this level could lead to an accelerated sell-off towards $72.00 and $70.00, wiping out gains for 2024 and potentially testing the December 13 low of $68.

