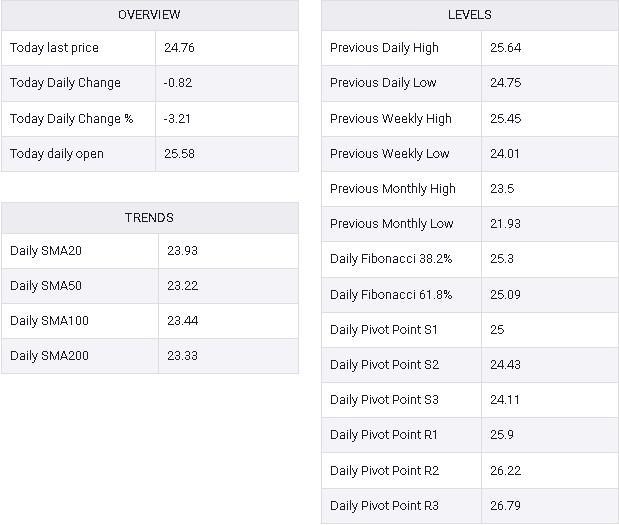
- Silver prices see a significant drop to $24.75, shedding over 3% in response to a strengthening US Dollar.
- Technical analysis reveals a bearish engulfing pattern, despite a recent ‘golden cross’, signaling mixed signals for traders.
- The RSI indicates diminishing buying pressure, hinting at a potential bearish swing.
Silver’s price plunged on Thursday amidst a risk-off impulse, reinvigorating the US Dollar. Consequently, the grey metal dropped more than $0.70, or 3.15%, as the XAG/USD traded at $24.75 after hitting a daily high of $25.77.
XAG/USD Price Analysis: Technical outlook
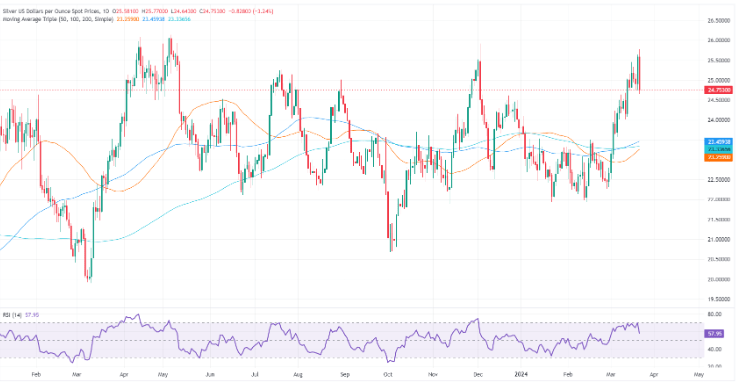
Silver is currently experiencing a downturn, evidenced by the formation of a ‘bearish engulfing’ chart pattern over the past couple of days. Despite the 50-day moving average (DMA) crossing above the 200-DMA, creating a classic ‘golden cross’ indicative of bullish momentum, current market dynamics suggest otherwise.
Although the Relative Strength Index (RSI) hovers just below 60, indicating ongoing moderate buying pressure after peaking around 70, its decline from higher levels suggests potential waning momentum, potentially paving the way for bears to gain traction.
The recent retracement has caused the price to retreat from resistance near the $26.00 mark. Immediate support is anticipated near December’s high, now turned support, at $24.60, followed by the $24.00 level. A breach of the latter could potentially lead to a downturn towards the $23.00 area, characterized by previous cycle lows.
Conversely, a daily close for XAG/USD above $25.00 may signal a challenge towards yearly highs at $25.77, followed by last year’s high at $25.91.
XAG/USD Price Action – Daily Chart
XAG/USD
